9.1.3 Determine the I/O
for Persistent Storage
The iostat command tool reports the following three types of
statistics.
- Terminal statistics
- CPU statistics
- Disk statistics
This section discusses the iostat command to identify I/O-subsystem
and CPU bottlenecks using CPU statistics and disk statistics. The following is
a sample iostat output report.
# iostat
tty: tin tout avg-cpu: % user % sys % idle % iowait
0.1 9.0 7.7 6.8 85.0 0.5
Disks: % tm_act Kbps tps Kb_read Kb_wrtn
hdisk1 0.1 0.7 0.0 39191 242113
hdisk0 0.8 11.1 0.8 3926601 822579
cd0 0.0 0.0 0.0 780 0
The following sections will discuss some of the frequently referenced fields
from the preceding example.
The following fields of CPU statistics in the iostat
report determine the CPU usage and the I/O status.
-
% user
- The % user column shows the percentage of CPU resource spent in user mode.
A UNIX process can execute in user or system mode. When in user mode, a process
executes within its own code and does not require kernel resources.
-
% sys
- The % sys column shows the percentage of CPU resource spent in system mode.
This includes CPU resource consumed by kernel processes and others that need
access to kernel resources. For example, the reading or writing of a file
requires kernel resources to open the file, seek a specific location, and read
or write data. A UNIX process accesses kernel resources by issuing system
calls.
-
% idle
- The % idle column shows the percentage of CPU time spent idle, or waiting,
without pending local disk I/O. If there are no processes on the run queue, the
system dispatches a special kernel process called wait. On most AIX systems,
the wait process ID (PID) is 516.
-
% iowait
- The % iowait column shows the percentage of time the CPU was idle with
pending local disk I/O. The iowait state is different from the idle state in
that at least one process is waiting for local disk I/O requests to complete.
Unless the process is using asynchronous I/O, an I/O request to disk causes the
calling process to block (or sleep) until the request is completed. Once a
process's I/O request completes, it is placed on the run queue.
The following conclusions can be drawn from the iostat reports.
- A system is CPU-bound if the sum of user and system
time exceeds 90 percent of CPU resource on a single-user system or 80 percent
on a multiuser system. This condition means that the CPU is the limiting factor
in system performance.
- A high iowait percentage indicates the system has a memory shortage or
an inefficient I/O subsystem configuration. Understanding the I/O bottleneck
and improving the efficiency of the I/O subsystem requires more data than
iostat command output can provide. However, typical solutions might
include:
- Limiting the number of active logical volumes and file systems placed on a
particular physical disk (the idea is to balance file I/O evenly across all
physical disk drives).
- Spreading a logical volume across multiple physical disks (this is
useful when a number of different files are being accessed).
- Creating multiple JFS logs for a volume group and assigning them to
specific file systems (this is beneficial for applications that create, delete,
or modify a large number of files, particularly temporary files).
- Backing up and restoring file systems to reduce fragmentation.
(Fragmentation causes the drive to seek excessively and can be a large portion
of overall response time).
- Adding additional drives and rebalancing the existing I/O subsystem.
- On systems running a primary application, high I/O wait percentage may
be related to workload. In this case, there may be no way to overcome the
problem.
- On systems with many processes, some will be running while others wait
for I/O. In this case, the iowait can be small or zero because running
processes hide wait time. Although iowait is low, a bottleneck may still
limit application performance.
To understand the I/O subsystem thoroughly, you need to examine the disk
statistics of iostat report in the following section.
The disk statistics portion of the iostat output
determines the I/O usage. This information is useful in determining whether a
physical disk is the bottleneck for performance. The system maintains a history
of disk activity by default. The history is disabled if you see the following
message:
Disk history since boot not available.
Disk I/O history should be enabled since the CPU resource used in
maintaining it is insignificant. History-keeping can be disabled or enabled by
executing smitty chgsys, the SMIT fast path command that will display
the screen as shown in Figure 104. Change the option
Continuously maintain DISK I/O history to TRUE to enable the
history keeping option..
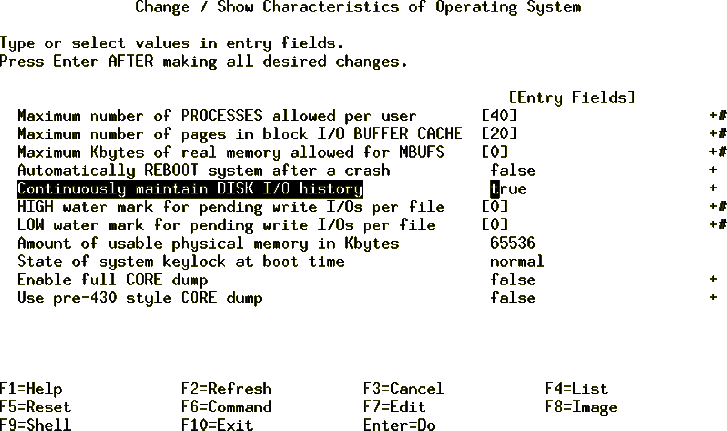
Figure 104: Enabling the Disk I/O History
The following fields of the iostat report determine the physical
disk I/O.
-
Disks
- The Disks column shows the names of the physical volumes. They are either
hdisk or cd followed by a number. (hdisk0 and cd0 refer to the first physical
disk drive and the first CD disk drive, respectively.)
-
% tm_act
- The % tm_act column shows the percentage of time the volume was active.
This is the primary indicator of a bottleneck.
-
Kbps
- Kbps shows the amount of data read from and written to the drive in KBs per
second. This is the sum of Kb_read plus Kb_wrtn, divided by the number of
seconds in the reporting interval.
-
tps
- tps reports the number of transfers per second. A transfer is an I/O
request at the device-driver level.
-
Kb_read
- Kb_read reports the total data (in KB) read from the physical volume during
the measured interval.
-
Kb_wrtn
- Kb_wrtn shows the amount of data (in KB) written to the physical volume
during the measured interval.
There is no unacceptable value for any of the fields in the preceding
section because statistics are too closely related to application
characteristics, system configuration, and types of physical disk drives and
adapters. Therefore, when evaluating data, you must look for patterns and
relationships. The most common relationship is between disk utilization and
data transfer rate.
To draw any valid conclusions from this data, you must understand the
application's disk data access patterns (sequential, random, or a combination)
and the type of physical disk drives and adapters on the system. For example,
if an application reads and writes sequentially, you should expect a high
disk-transfer rate when you have a high disk-busy rate. (Note: Kb_read and
Kb_wrtn can confirm an understanding of an application's read and write
behavior, but they provide no information on the data access patterns).
Generally you do not need to be concerned about a high disk-busy rate as
long as the disk-transfer rate is also high. However, if you get a high
disk-busy rate and a low data-transfer rate, you may have a fragmented logical
volume, file system, or individual file.
What is a high data-transfer rate? That depends on the disk drive and the
effective data-transfer rate for that drive. You should expect numbers between
the effective sequential and effective random disk-transfer rates. The
effective transfer rates for a few of the common SCSI-1 and SCSI-2 disk drives
are shown in Table 15:
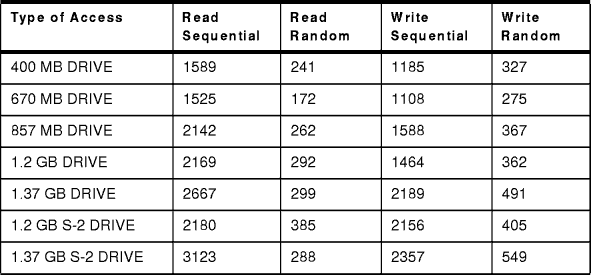
Table 15: Effective Transfer Rates (KB/sec)
You can also use the data captured by the iostat command to analyze
the requirement of an additional SCSI adapter (if the one installed in your
system is the I/O bottleneck) by tracking transfer rates, and finding the
maximum data transfer rate for each disk.
The disk usage percentage (% tm_act) is directly proportional to resource
contention and inversely proportional to performance. As disk use increases,
performance decreases and response time increases. In general, when a disk's
use exceeds 70 percent, processes are waiting longer than necessary for I/O to
complete because most UNIX processes block (or sleep) while waiting for their
I/O requests to complete.
To overcome I/O bottlenecks, you can perform the following actions:
- Look for busy versus idle drives. Moving data from more busy to less busy
drives may help alleviate a disk bottleneck.
- Check for paging activity because paging to and from disk will also
contribute to the I/O load. Move paging space from a more busy drive to a less
busy drive to improve the performance.
9.3 Paging Space
Management