

 Chapter 9. System
Performance
Chapter 9. System
PerformanceThe vmstat command reports statistics about
processes, virtual memory, paging activity, faults, CPU activity, and disk
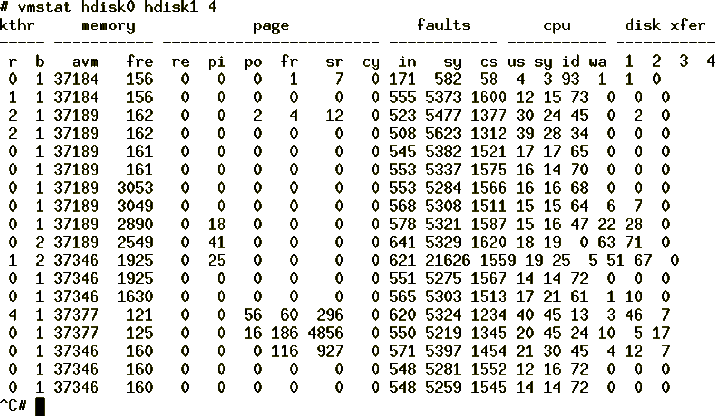
transfers. A sample of vmstat output report is shown in
Figure 103.

Figure 103: vmstat Output Example with Disk Activity
The following sections will discuss some of the frequently referenced fields for analysis from the preceding example of the vmstat report.
When processes on the system require more pages of memory than are available in RAM, working pages may be paged out to paging space and then paged in when they are needed again. Accessing a page from paging space is considerably slower than accessing a page directly from RAM. For this reason, constant paging activity can cause system performance degradation. The paging activity is determined by the following four fields.
The following conclusions can be drawn from the various filed values.
The following fields of vmstat report determine the status of CPU usage.
The values of various fields can lead you to the following conclusions:
The I/O for persistent storage is the I/O (disk reads and writes) initiated by VMM excluding paging space I/O. The following example shows how to calculate I/O for persistent storage using vmstat command with -s option.
# vmstat -s
    3983934 total address trans. faults
     384406 page ins
     218433 page outs
      16928 paging space page ins
      35468 paging space page outs
          0 total reclaims
    1738350 zero filled pages faults
      19584 executable filled pages faults
    2035457 pages examined by clock
        132 revolutions of the clock hand
     393739 pages freed by the clock
      57211 backtracks
          0 lock misses
        161 free frame waits
          0 extend XPT waits
     197637 pending I/O waits
     340980 start I/Os
     340980 iodones
   16706966 cpu context switches
   46963483 device interrupts
          0 software interrupts
          0 traps
  161793600 syscalls
There are 23 separate events reported by the vmstat -s output, but the following four are used to calculate the persistent storage I/O.
If the value for paging space page ins is subtracted from the (systemwide) value for page ins, the result is the number of persistent pages (files) that were read from disk. Similarly, if the value for paging space page outs is subtracted from the (systemwide) value for page outs, the result is the number of persistent pages (files) that were written to disk.
The preceding example shows that 367478 (384406-16928) number of pages are read from disk and 182965 (218433-35468) number of pages are written to the disk.
These counts apply to the time since system initialization. If you need counts for a given time interval, execute vmstat -s at the time you want to start monitoring and again at the end of the interval. The deltas between like fields of successive reports will be the count for the interval.